
Real-time Analytics
Stop reacting late. See it as it happens.
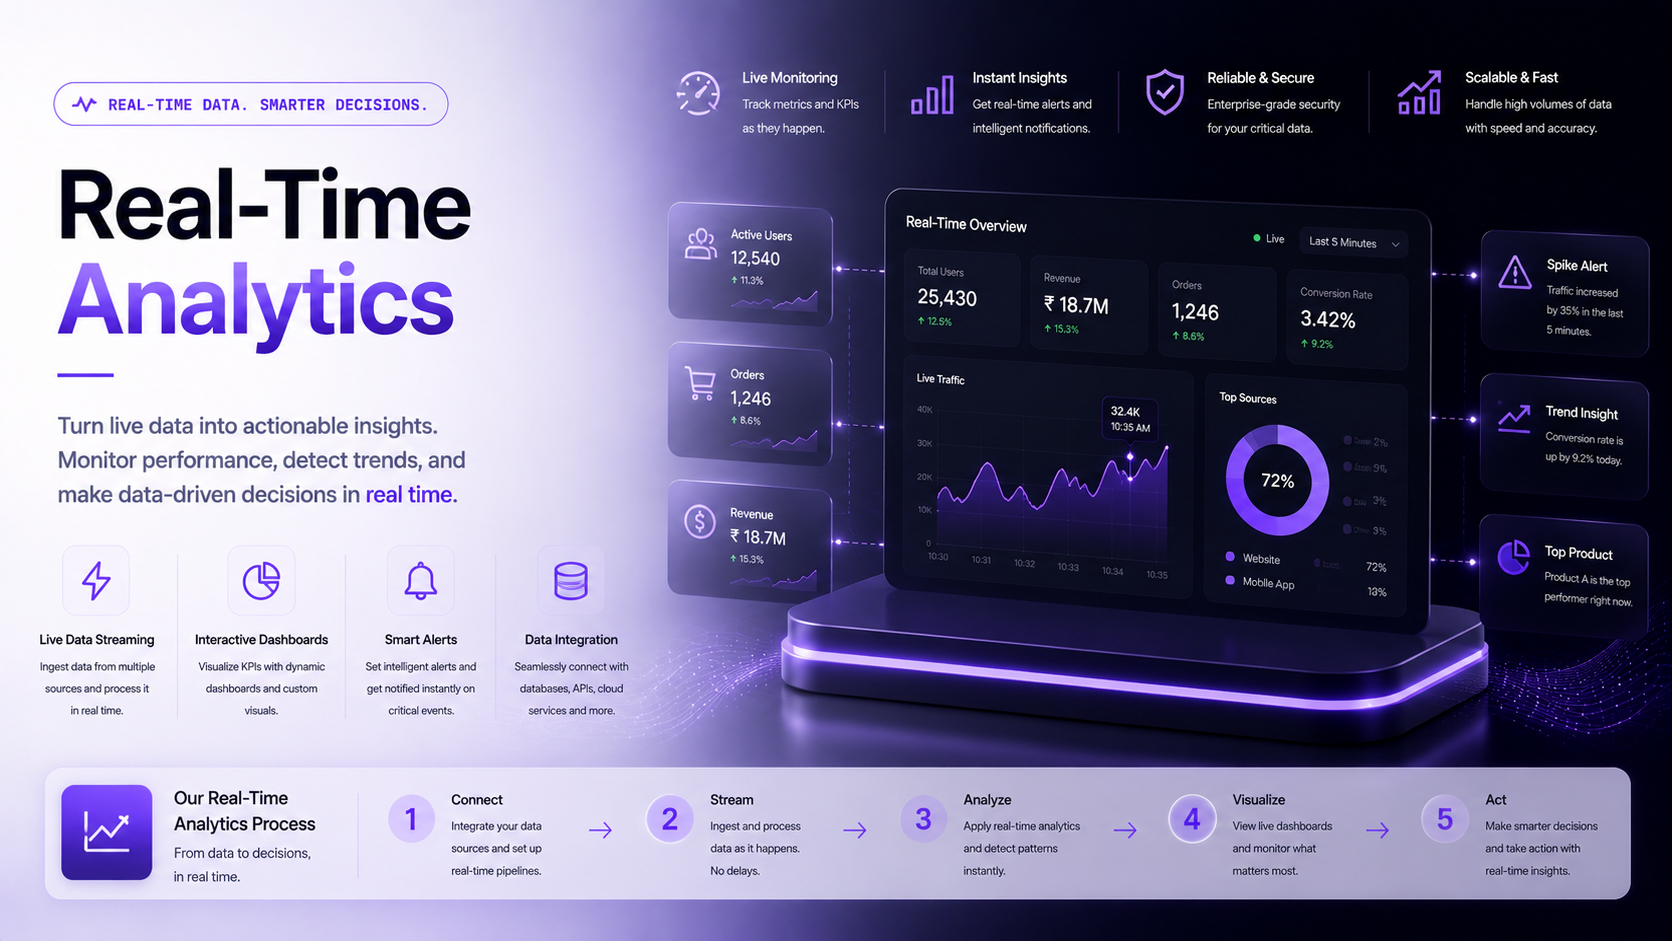
Daily reports tell you about problems after they cost you money. We build streaming pipelines and live dashboards that surface what's happening right now, and alert you the moment it matters.
- Sub-sec
- Data Latency
- 24/7
- Live Dashboards
- Instant
- Anomaly Alerts
- Millions
- Events / Day
- Kafka
- Apache Flink
- ClickHouse
- Grafana
- WebSockets
- Redis
- TimescaleDB
- MQTT
- Power BI
Key Takeaways
- Parix Digital builds real-time analytics: streaming pipelines and live dashboards with sub-second latency.
- Powered by Kafka, Flink, and ClickHouse, with instant threshold and anomaly alerts.
- Ideal for live production-line, sales, and operations monitoring at millions of events per day.
Discuss this page with AI
Open your AI assistant with this page loaded to summarise it, ask questions, and go deeper.
The Reality
Yesterday's report can't fix today's problem.
Decisions on Stale Data
By the time the morning report lands, the line has already run scrap for hours.
You Find Out Too Late
A machine fault, payment failure, or fraud spike is only visible at end-of-day.
Static, Lifeless Reports
PDFs and weekly decks cannot answer "what is happening right now?"
No Alerting
Nobody is watching the dashboard at 2am. Problems escalate silently.
Can't Handle the Volume
Sensor, clickstream, and transaction data arrive faster than a spreadsheet can absorb.
Laggy Dashboards
Heavy queries on the production database slow everything down.
What We Deliver
Live visibility and instant alerts
Streaming Architecture
A scalable event backbone for everything that happens in your business.
- Kafka/Pulsar Setup
- Topic & Partition Design
- Exactly-once Delivery
- Back-pressure Handling
Event & IoT Pipelines
Capture data from apps, machines, and sensors in real time.
- IoT/MQTT Ingestion
- App Event Tracking
- Database Change Capture
- Schema Registry
Real-time Processing
Aggregates, joins, and KPIs computed on the fly.
- Flink/Stream Processing
- Windowed Aggregations
- Live KPI Computation
- Enrichment & Joins
Live Dashboards
Sub-second dashboards for every team and screen.
- Grafana/Custom UI
- WebSocket Live Updates
- Drill-down Views
- Wallboard Mode
Alerting & Anomaly Detection
Threshold and ML-based alerts that reach the right person.
- Threshold & ML Alerts
- Slack/SMS/Email
- On-call Routing
- Alert Deduplication
Scale & Reliability
A fast analytical store and resilient infrastructure.
- ClickHouse/TimescaleDB
- Horizontal Scaling
- High Availability
- Latency Monitoring
Tools & Technology
The stack behind the work
Streaming
Kafka, Pulsar, MQTT, Kinesis
Processing
Apache Flink, Spark Streaming, ksqlDB
Real-time Store
ClickHouse, TimescaleDB, Redis
Visualization
Grafana, Power BI, WebSockets, Custom UI
Process
How we get you live
- 01
Stream
Capture events and sensor data into a scalable backbone.
- 02
Process
Compute KPIs and aggregations in real time.
- 03
Visualise
Build live dashboards per team and screen.
- 04
Alert & Scale
Anomaly alerts go live and the platform is hardened for volume.
Why Parix Digital
Real-time done right, and reliable.
- Sub-second latency from event to dashboard
- Alerts that reach the right person instantly
- Built to handle millions of events a day
- Won't slow down your production database
- Live dashboards tailored per team and screen
- Resilient, monitored, high-availability infrastructure
“We've worked with many agencies in the past, but Parix Digital stands out. Their SEO + automation combo was exactly what we needed to boost organic traffic and streamline operations.”
Radhika Vyas
Local Guide, 10 reviews, Jun 2025
“Extraordinary service support. Enthusiastic owner.”
Vihang Limaye
Local Guide, 6 reviews, 2025
Proven Results
Related case studies
FAQ
Frequently Asked Questions
How real-time is it really?
For most use cases we achieve sub-second to a few-seconds latency from event to dashboard, whether your infrastructure runs in US, UK, or Indian cloud regions.
Can you monitor our production line or machines?
Yes. We ingest from IoT sensors and PLCs via MQTT or OPC-UA to power live OEE, downtime, and quality dashboards. We support plants in India as well as US and UK facilities monitored remotely across time zones.
Won't heavy dashboards slow down our database?
No. We separate analytics from your operational database using a streaming pipeline and a fast analytical store like ClickHouse.
Can it alert us automatically?
Yes. Threshold and ML-based anomaly alerts are delivered via Slack, SMS, email, or PagerDuty, routed to whoever is on call in your US, UK, or India teams.
How much data volume can it handle?
Architectures scale horizontally to millions of events per day and beyond.
Ready to build your Real-time Analytics?
Tell us about your goals and current setup. We'll get back to you within 24 hours with a tailored plan.
UK · India · USA | Enterprise Grade Delivery | 24hr Response Time